
For this blog post, I will be analyzing the chart above from the American Press Institute, which provides statistics about opinions regarding "the news media" and "the news media you use the most often". In this chart, there are three different demographics from which data is provided, which are: Democrats, Independents and Republicans.
One of the major trends in this chart is that Democrats are more likely to have positive opinions regarding "the news media", while Republicans are more likely to have negative opinions. As you can see in the graph, Democrats have the highest percentages, an average of 43.25% among all categories regarding "the news media", while Republicans have the lowest, at an average of 13.25%.
Another major trend in this chart is that all demographics think more positively about "the news media you use the most often". The chart shows increased numbers among all demographics regarding "the news media you use the most often". On average, 54.25% of Democrats agree with all of the statements regarding "the news media you use the most often", with Independents at 41.25% and Republicans at 47.25%.
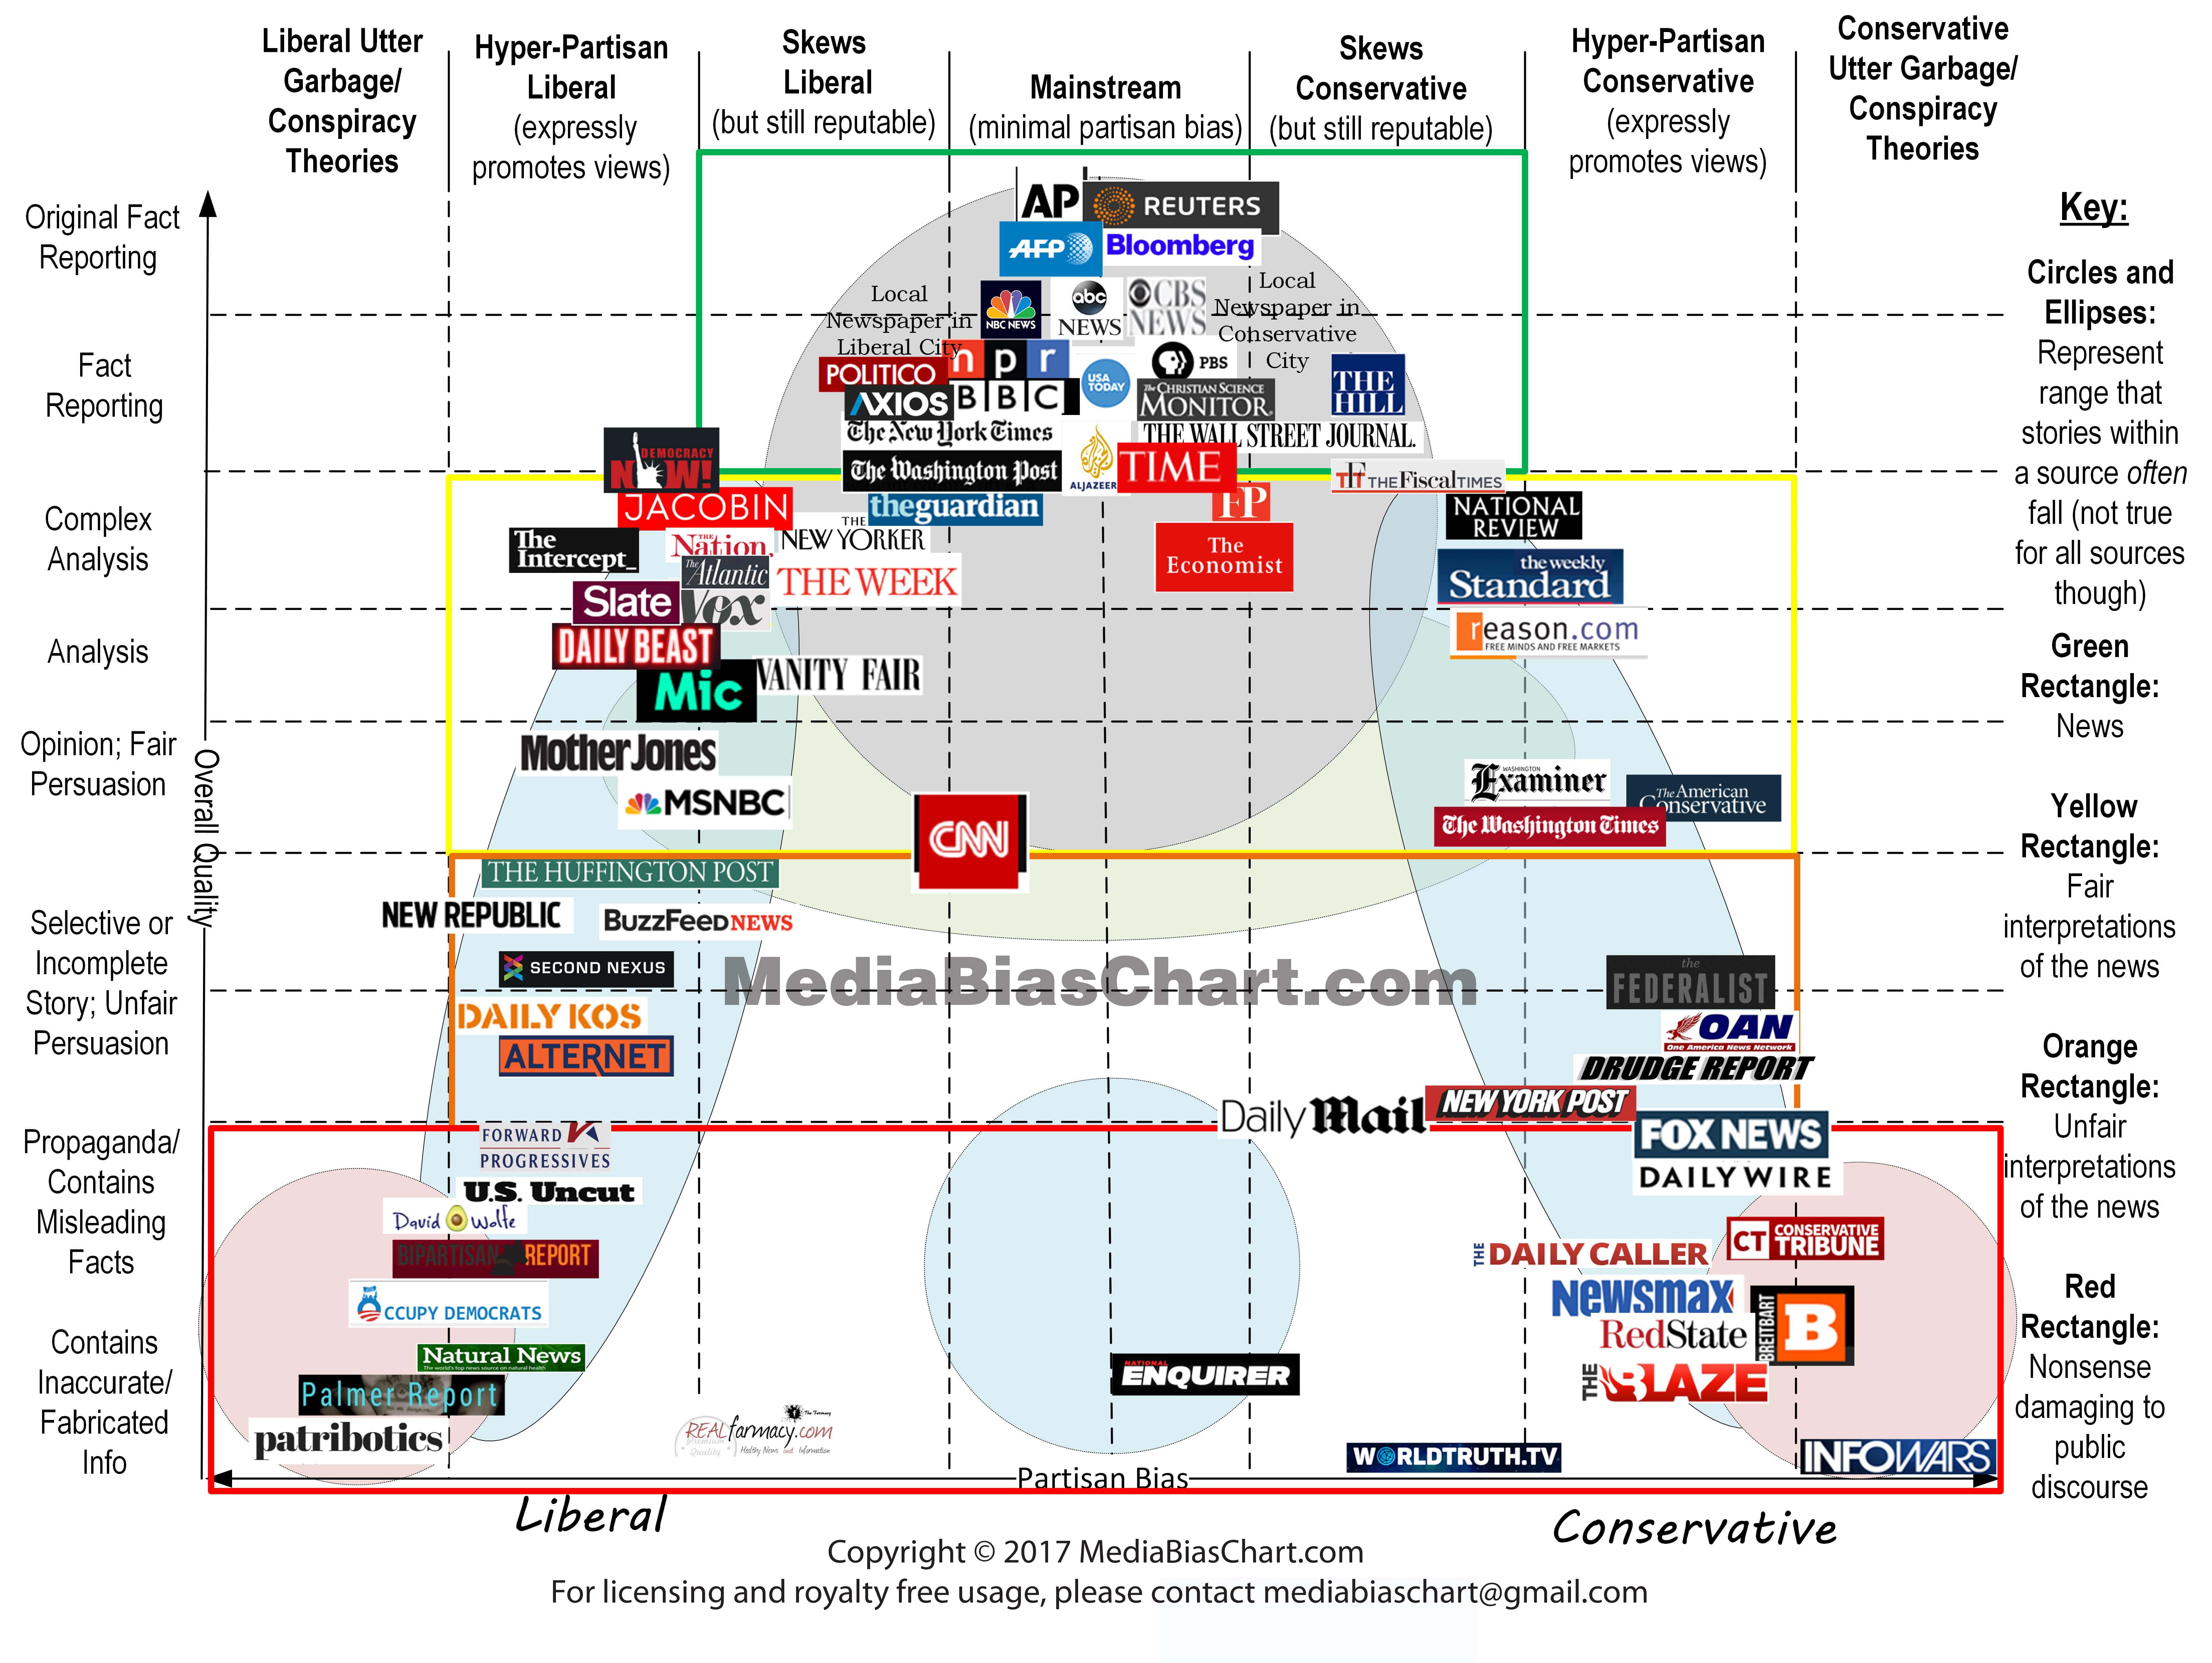
These patterns correlate with one another, as it shows an apparent imbalance in credibility between the general news media and the news media preferred by members of each political parties. This imbalance however, is mostly due to the media bias of news media websites. For example, as seen in the chart below, members of the Republican party might believe that Fox News, a conservative-leaning news media source, is more credible news media source than The Huffington Post, a liberal-leaning news media source. Not only this, but in the chart below, it also shows multiple news media sources on each side of the political spectrum which promote inaccurate or fabricated information, which could potentially be another source of media bias.
Comments
Post a Comment